Surface-enhanced Raman spectroscopy was used to investigate the effectiveness of two types of packaging for protecting ground pork from lipid oxidation.

Thermo Scientific DXR3 Raman Microscope. Image credit: Thermo Fisher Scientific – Materials & Structural Analysis
Introduction
Lipid oxidation is a significant problem for the meat industry. This is because fat oxidation not only affects sensory quality in terms of smell and taste, but also leads to the formation of toxic compounds such as malondialdehyde (MDA) and cholesterol oxidation products. Carbonyls, alcohols and volatile acids.
The degree of oxidation depends on various factors such as the nature and origin of the meat, the fat content of the meat, the temperature at which the meat is stored, the availability of oxygen and the type of packaging.1,2
Artificial antioxidants are commonly added to meat products to prevent oxidation, but today consumers are demanding more natural products.3
Several studies have been carried out to evaluate the antioxidant activity of several essential oils or extracts from plants or spices such as cinnamon, rosemary or oregano. A new trend has been identified to create innovative packaging by incorporating these natural antioxidants directly into packaging materials.4,5,6
These materials, often films, are called „active packaging” because they allow the controlled release of active agents (on the surface or in the internal atmosphere of the product) or work by trapping molecules that are harmful to the quality of the food.
However, accurate determination of the antioxidant performance of these films is necessary to select the right packaging for each food product.
Raman spectroscopy is a promising candidate and a leader, among all available techniques, when detecting most molecular species with high sensitivity and specificity, especially in the presence of Surface-enhanced Raman scattering (SERS).
SERS is the name given to a physical phenomenon that occurs in the presence of a roughly nanostructured metal surface. Thanks to a combination of a chemical effect and an electromagnetic effect, SERS intensifies the Raman signals from molecules adsorbed on the surface.7
Typically gold or silver metals are used, and these can be produced by metal plating, electrochemical hardening, or deposition of nanoparticles (often in colloidal form).
Although commercial solutions are available, many researchers prefer to develop their own SERS substrates. The aim of this work was to evaluate the ability of a home-made SERS substrate to compare fat oxidation over time in ground pork preserved in one of two packaging types: low-density polyethylene (LDPE) in conventional packaging or in active packaging containing oregano extract.
Material and method
Fresh ground pork was purchased in bulk from a local supermarket, and 22 g of meat samples were placed into 5-cm diameter polystyrene Petri dishes. Next, each sample was covered with an active film and packaged in an LDPE bag under a normal condition.
Conventional LDPE films were also used to prepare reference samples. Each sample was stored in a refrigerator at 5°C and after 0, 7, 9, 11, 14 and 16 days, their lipid extracts were analyzed using a home-made SERS substrate based on silver nanoparticles deposited on a glass Petri dish.
Analysis was performed at low temperature using a special home-made cooling system, and SERS spectra were measured at -2 °C with a Thermo Scientific ™ DXR3 Raman microscope (Waltham, MA, USA) with a 532 nm laser, 900. Lines/mm Grating 50-3500 cm-1 Spectral range and x10 objective (NA 0.40).
The laser power was set to 5 mW, and 20 exposures of 30 each were selected to acquire all the data. Thermo Scientific™ OMNIC™ v. 9.2 Software used for data collection and analysis. Each measurement was performed in triplicate.
The area ratio is 1655 cm-1 and 1439 cm-1 1655 c-1 (stretching of C=C bonds from unsaturation) lipid peroxidation and 1439 cm.-1 (scissor deformation of CH2) is not affected by it.
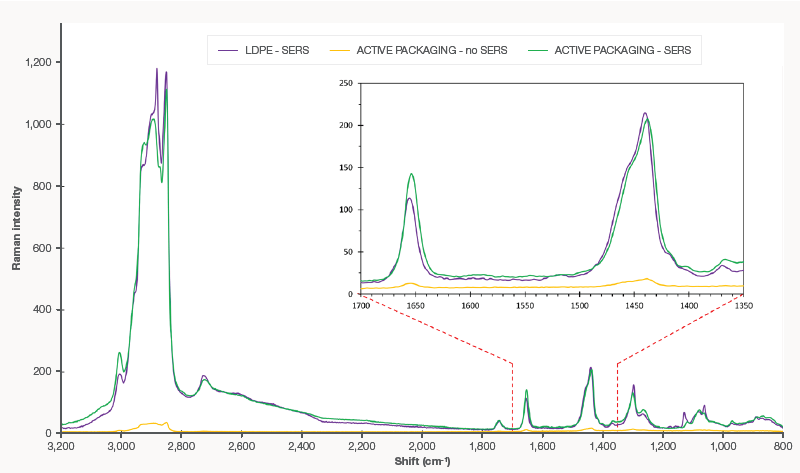
Figure 1. Typical Raman (yellow) and SERS spectra extracted from fatty meat 7Th day The highest peak is 1655 cm-1 Active packaging (green) indicates effective protection compared to LDPE (purple). Image credit: Thermo Fisher Scientific – Materials & Structural Analysis
Introduction
Results and discussion
Raman and SERS spectra of fat extracted from meat with n-hexane/diethyl ether (1:1) after seven days of storage in both conventional LDPE and active packaging are shown in Figure 1 . The SERS spectrum shows higher intensity bands than the conventional Raman spectrum, where the conventional and active packaging spectra were almost identical.
During the study it was found that the difference between oxidized and fresh samples was high SERS spectra measured at lower temperatures (data not shown). Calculation of enhancement factor (EF) for a given conversion is as follows:8

Where iSERS Signal intensity in selective transition with silver substrate, the following are true: IRaman The signal intensity at the same transition without the silver substrate is N, the number of molecules responsible for the expansionSERSand N is the number of molecules in the detection moduleRaman. The calculated expansion factors for the two groups of interest in this study were 1439 cm-1 and 1655 cm-1are shown in Table 1.
Table 1. EF was calculated to be 1439 cm-1 and 1655 cm-1 Bands. Source: Thermo Fisher Scientific – Materials & Structural Analysis
| . | . |
|---|---|
| EF1439 | 1.64·107 |
| EF1655 | 8.58·106 |
A very high performance of home-made SERS substrate has been demonstrated, as these are on the order of a factor of 10.7. High sensitivity and, therefore, faster signal acquisition is achieved by using such a substrate.

Measuring the relative change of saturation (RCU%) evaluates the packaging efficiency, where AR0 and ARn 1655 represents the area ratio between cm-1 and 1439 cm-1 SERS bands after day 0 and n days of storage, respectively. The higher the degree of lipid oxidation, the higher the RCU% value.
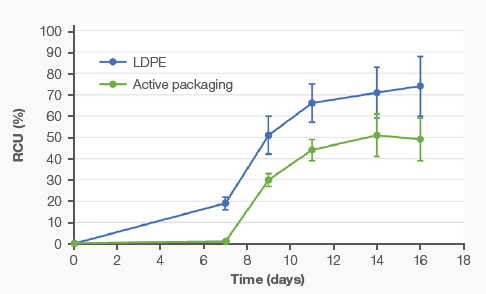
Figure 2. Relative change of unsaturation (RCU%) over time for conventional LDPE packaged meat and active packaged meat. Image credit: Thermo Fisher Scientific – Materials & Structural Analysis
Graphical results of RCU% obtained for meat stored in conventional and active packaging are shown in Figure 2. The increase in lipid oxidation over time is indicated by the values calculated in this study, which is accelerated from the seventh day of storage. .
Consistently, RCU% values are lower for active packaging than for conventional LDPE packaging. This result confirms that this type of packaging is very effective in preventing the saturation of fats in pork meat due to their oxidation over time.
Conclusion
Regarding surveillance Fat oxidation The effectiveness of the home-made SERS substrate and the home-made cooling system was demonstrated in time-packaged pork meat. The advantages of this technique, demonstrated by this study, are its speed and minimal sample handling requirements.
An observation was made regarding the improvement factor of the order of 107 Over regular ramen. Finally, this study confirmed the higher efficacy of active packaging containing oregano extracts against lipid oxidation in pork meat compared to conventional LDPE packaging.
Authorizations
Produced from materials originally written by Eloise Ribet Lancelot of Thermo Scientific France; Jesús Salafranca of the Institute of Engineering Research of Aragon (I3A), and Magdalena Vrona of the Institute of Engineering Research of Aragon (I3A).
Notes and further reading
1 PA Morrissey, DJ Buckley, BJA Sheehy, and FJ Monahan, “Vitamin E and meat quality,” Proceedings of the Nutrition Society, vol. 53, no. 2, p. 289–295, 1994, doi: 10.1079/pns19940034.
2 MS Brewer, WG Ikins, and CAZ Harbers, “TBA values, sensory properties, and volatility in ground pork during long-term frozen storage: Effects of packaging,” J Food Sci, vol. 57, no. 3, p. 558–564, 1992.
3 Z. Formanek, JP Kerry, FM Higgins, DJ Buckley, PA Morrissey, and J. Farkas, “Addition of synthetic and natural antioxidants to α-tocopheryl acetate supplemented beef patties: effects of antioxidants and packaging on lipid oxidation,” vol. 58, no. 4, p. 337–341, 2001, doi: 10.1016/S0309-1740(00)00149-2.
4 C. Nerin et al., “Stabilization of beef meat with new active packaging containing natural antioxidants,” J Agric Food Chem, vol. 54, no. 20, p. 7840–7846, 2006, doi: 10.1021/jf060775c.
5 J. Camo, JA Beltran and P. Roncales, “Extension of visual life of lamb with antioxidant active packaging,” Meat Sci, vol. 80, no. 4, p. 1086–1091, 2008, doi: 10.1016/j.meatsci.2008.04.031.
6 C. Nerin, L. Dover, and J. Salafranca, “Behavior of a new antioxidant active film and antioxidant model compounds,” J Food Eng, vol. 84, no. 2, p. 313–320, 2008, doi: 10.1016/j.jfoodeng.2007.05.027
7 B. Sharma, RR Frontiera, AI Henry, E. Rink and RB Van Duyn, “SERS: Materials, Applications and the Future,” Materials Today, Vol. 15, no. 1–2, p. 16–25, 2012, doi: 10.1016/S1369-7021(12)70017-2
8 EC Le Ru, E. Blackie, M. Meyer, and P. Etchegoin, “Surface-enhanced Raman scattering enhancement factors: a comprehensive review,” J Phys Chem C, vol. 111, no. 37, p. 13794–13803, 2007, doi: 10.1021/jp0687908.
9 M. Wrona, J. Lours, J. Salafranca, C. Joly, and C. Nerín, “A novel surface-enhanced Raman spectroscopy method, a rapid tool for the assessment of oxidation of fats in pork,” Applied Sciences (Switzerland), vol. 13, no. 9, 2023, doi: 10.3390/app13095533

This information was obtained, reviewed and modified from materials provided by Thermo Fisher Scientific – Materials & Structural Analysis.
For more information about this source, please visit Thermo Fisher Scientific – Materials & Structural Analysis.

„Oddany rozwiązywacz problemów. Przyjazny hipsterom praktykant bekonu. Miłośnik kawy. Nieuleczalny introwertyk. Student.